

What metrics are available on reports, and what do they mean?
InfluenceKit lets you track the performance of your content across multiple platforms, using deliverables. When you enter a deliverable with a URL, and connect the relevant external account, InfluenceKit will automatically collect metrics for that content.
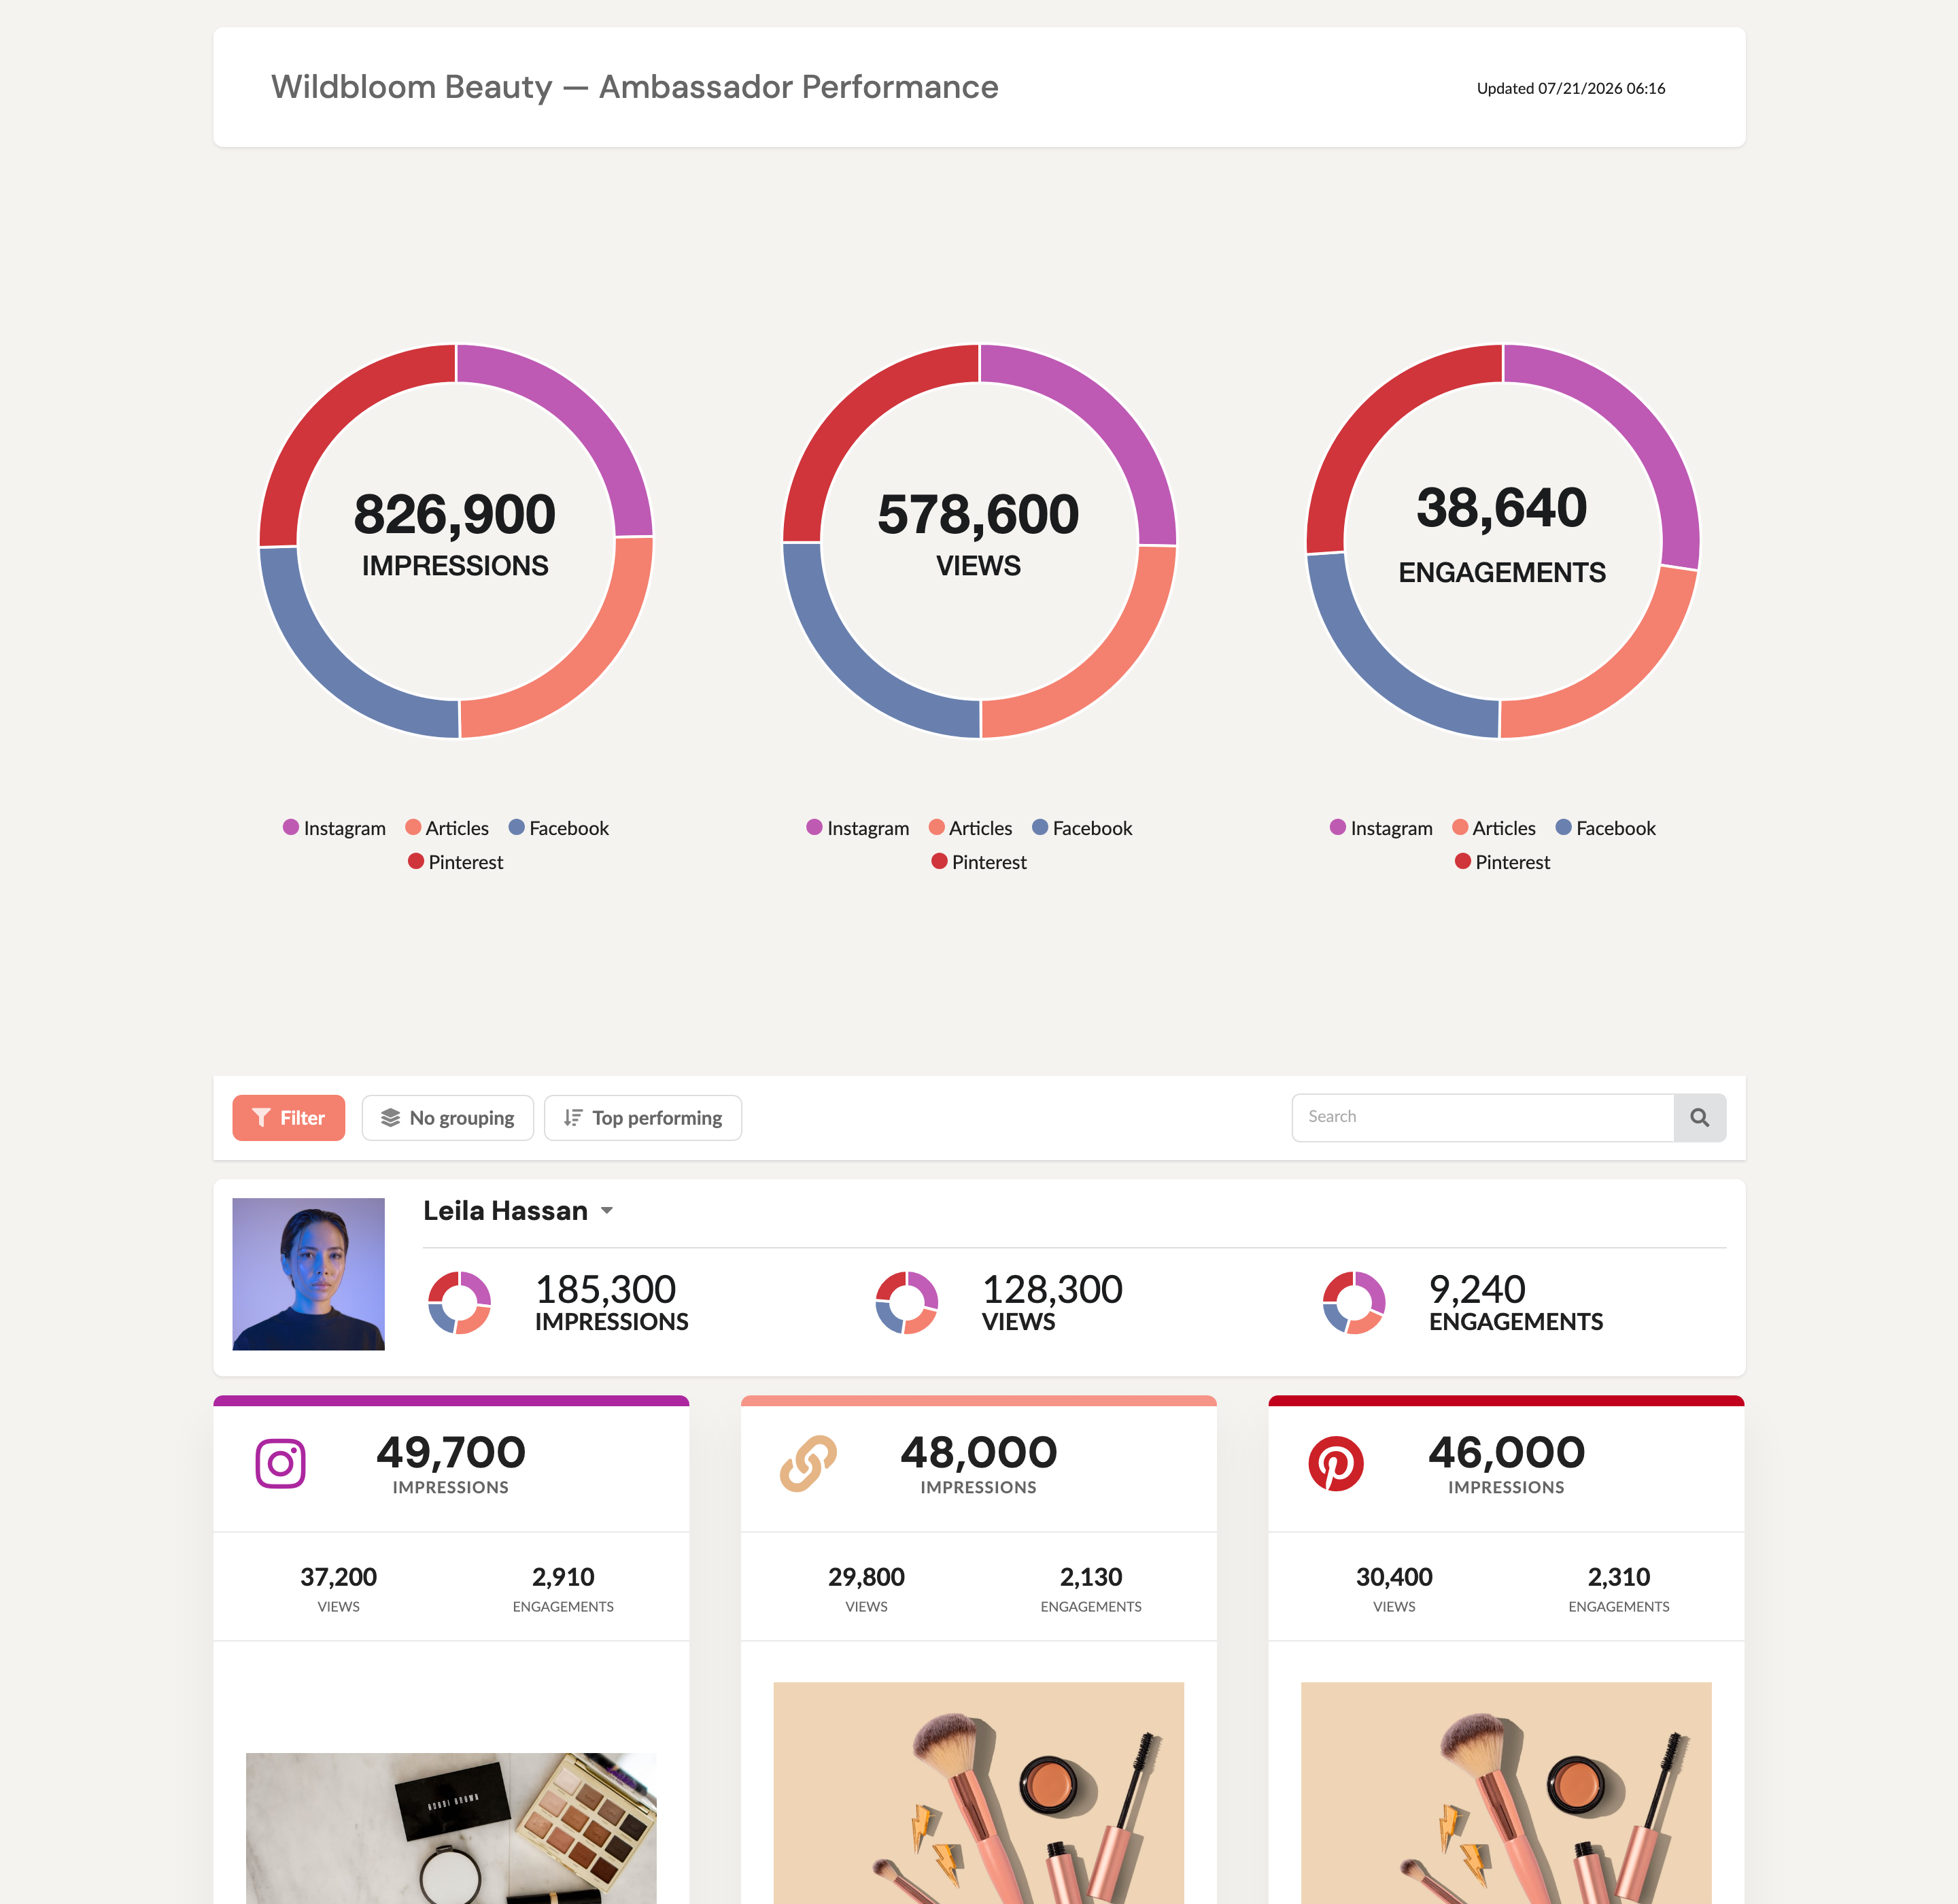
Every report totals your headline metrics — impressions, views and engagements — at the top, then breaks them down per creator and per post. The numbers below the donut charts (and on each deliverable card) are the same metrics defined in this article.
Summary metrics (calculated across the whole report)
The metrics further down this article are the ones we collect from each platform. Summary is the block at the top of your report that calculates figures from them — rates, revenue and cost efficiency across every platform at once.
It’s also where your report’s note now lives, so the thing you write about the campaign and the numbers that back it up sit together. If you’ve added notes to a report before, they’re already here — nothing moved out of your reports, the box just sits in the summary block now instead of under the title.
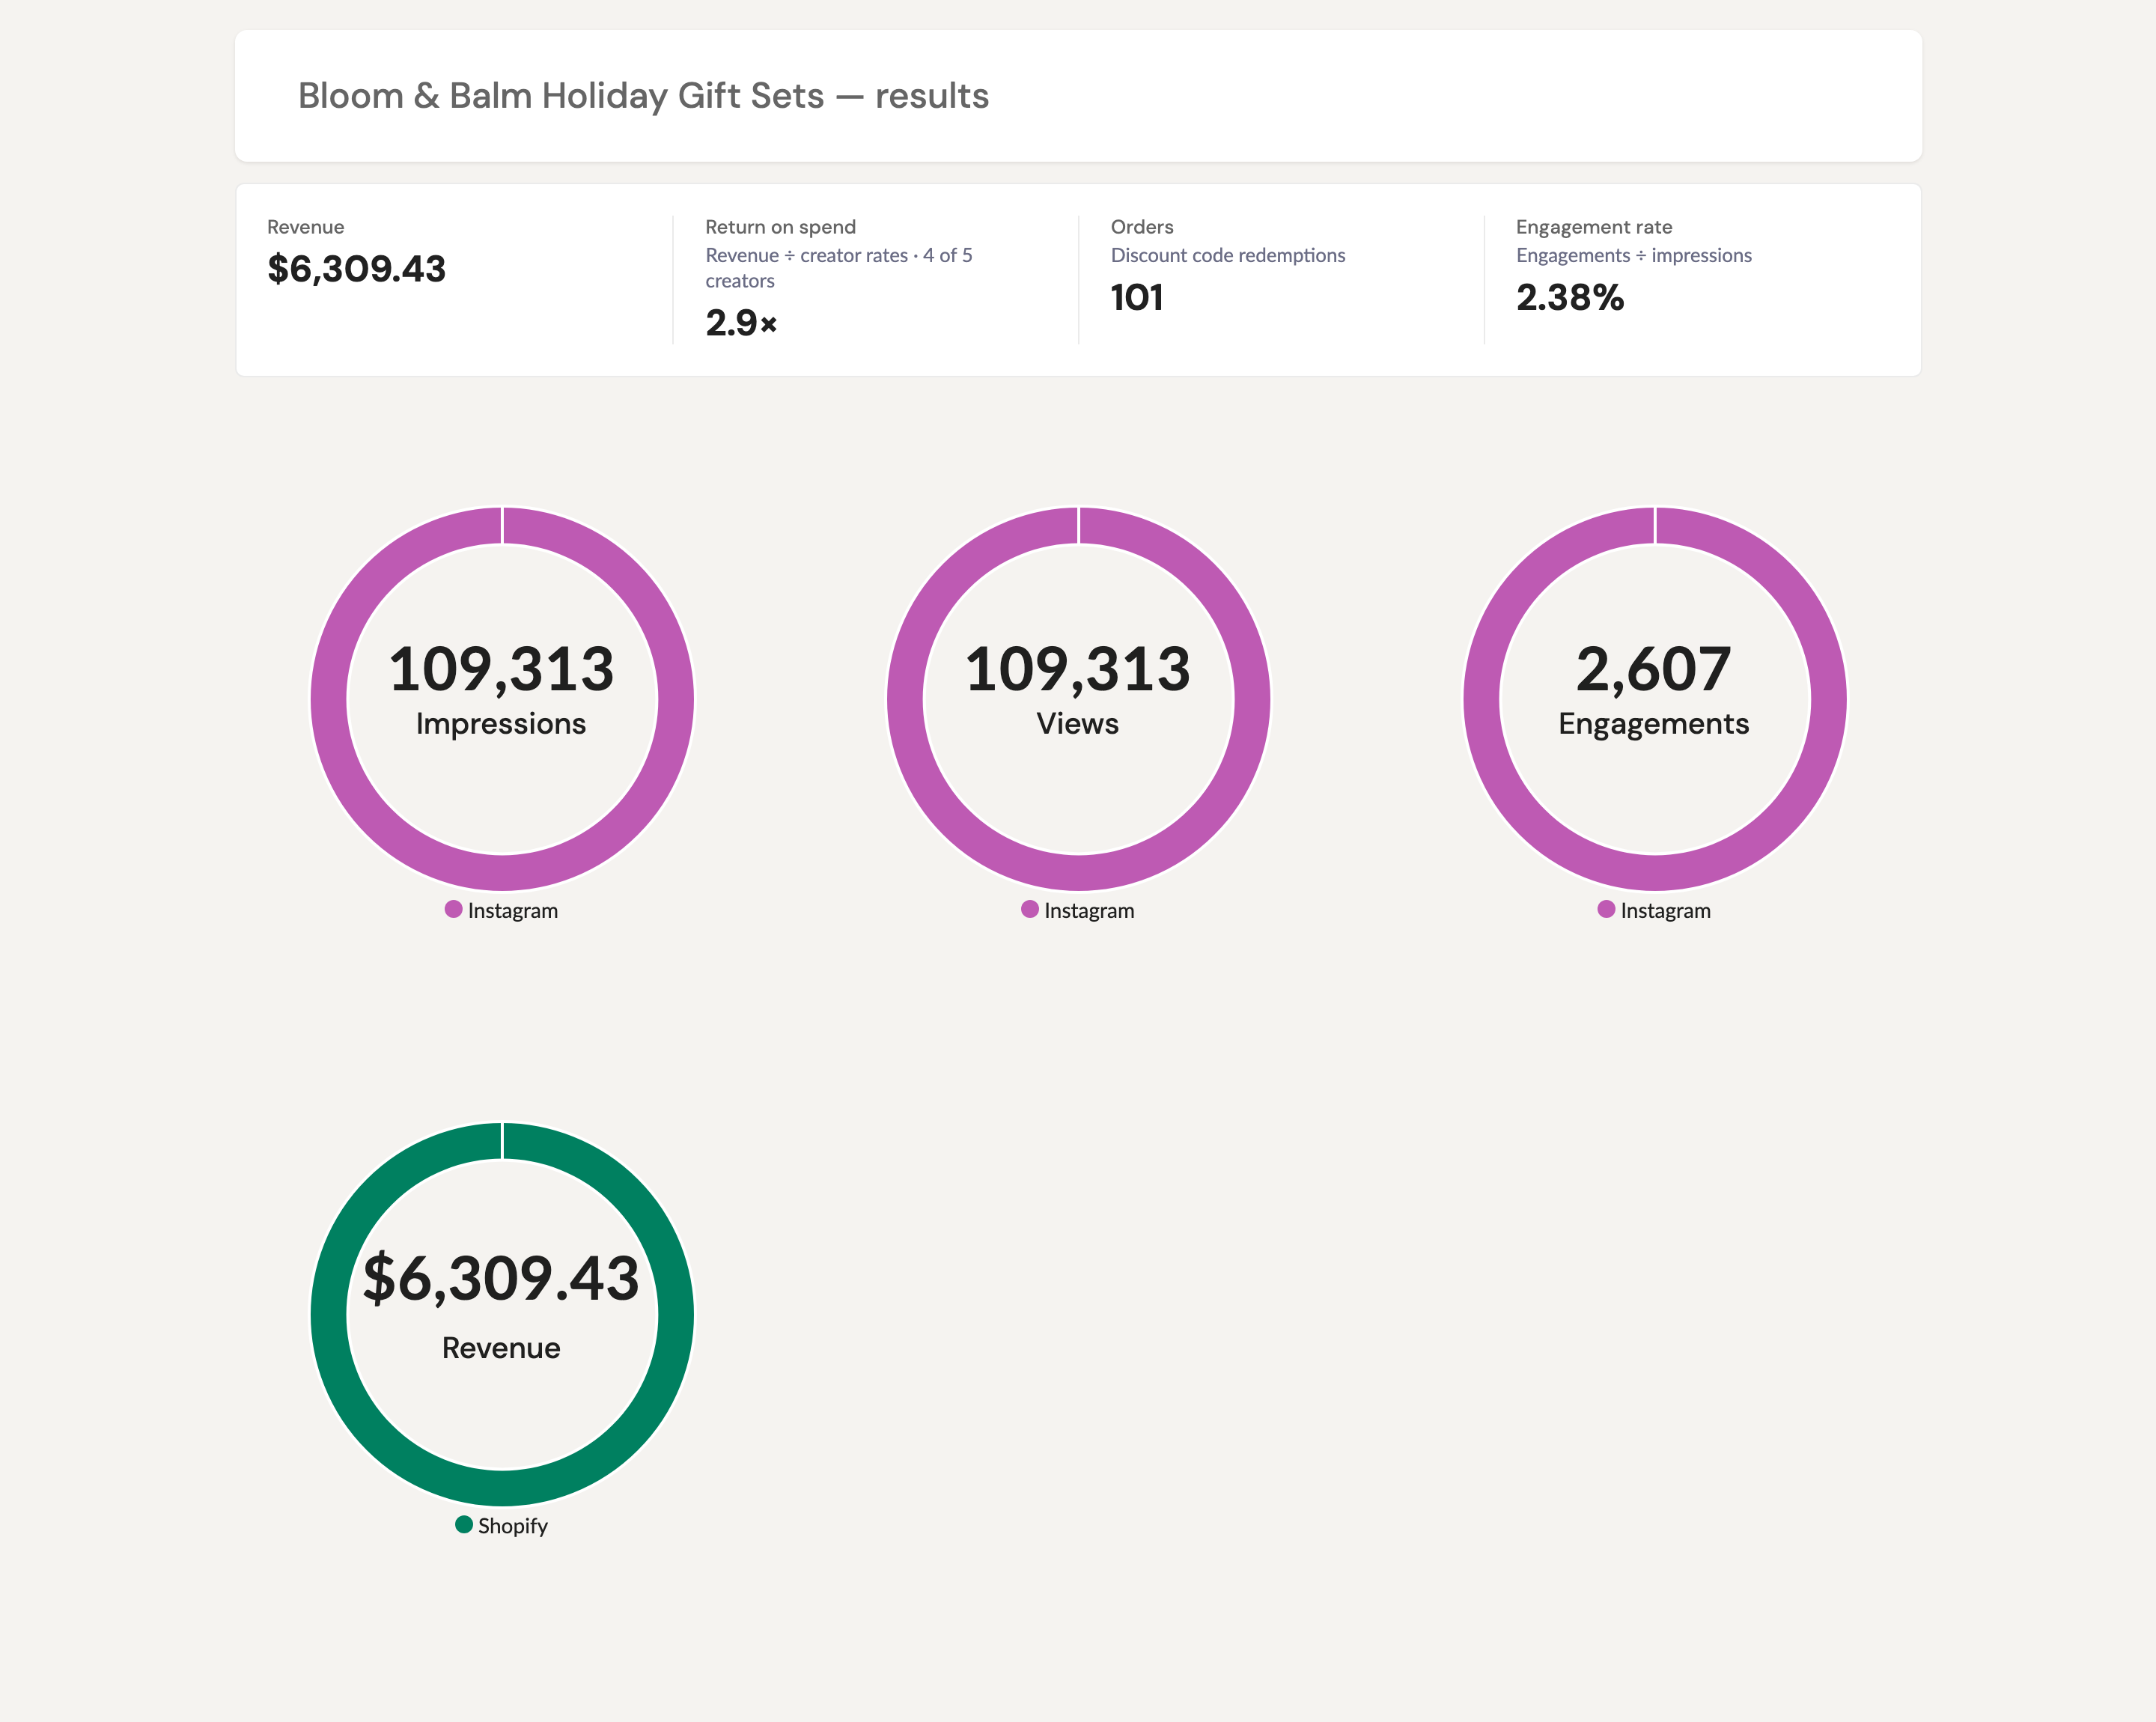
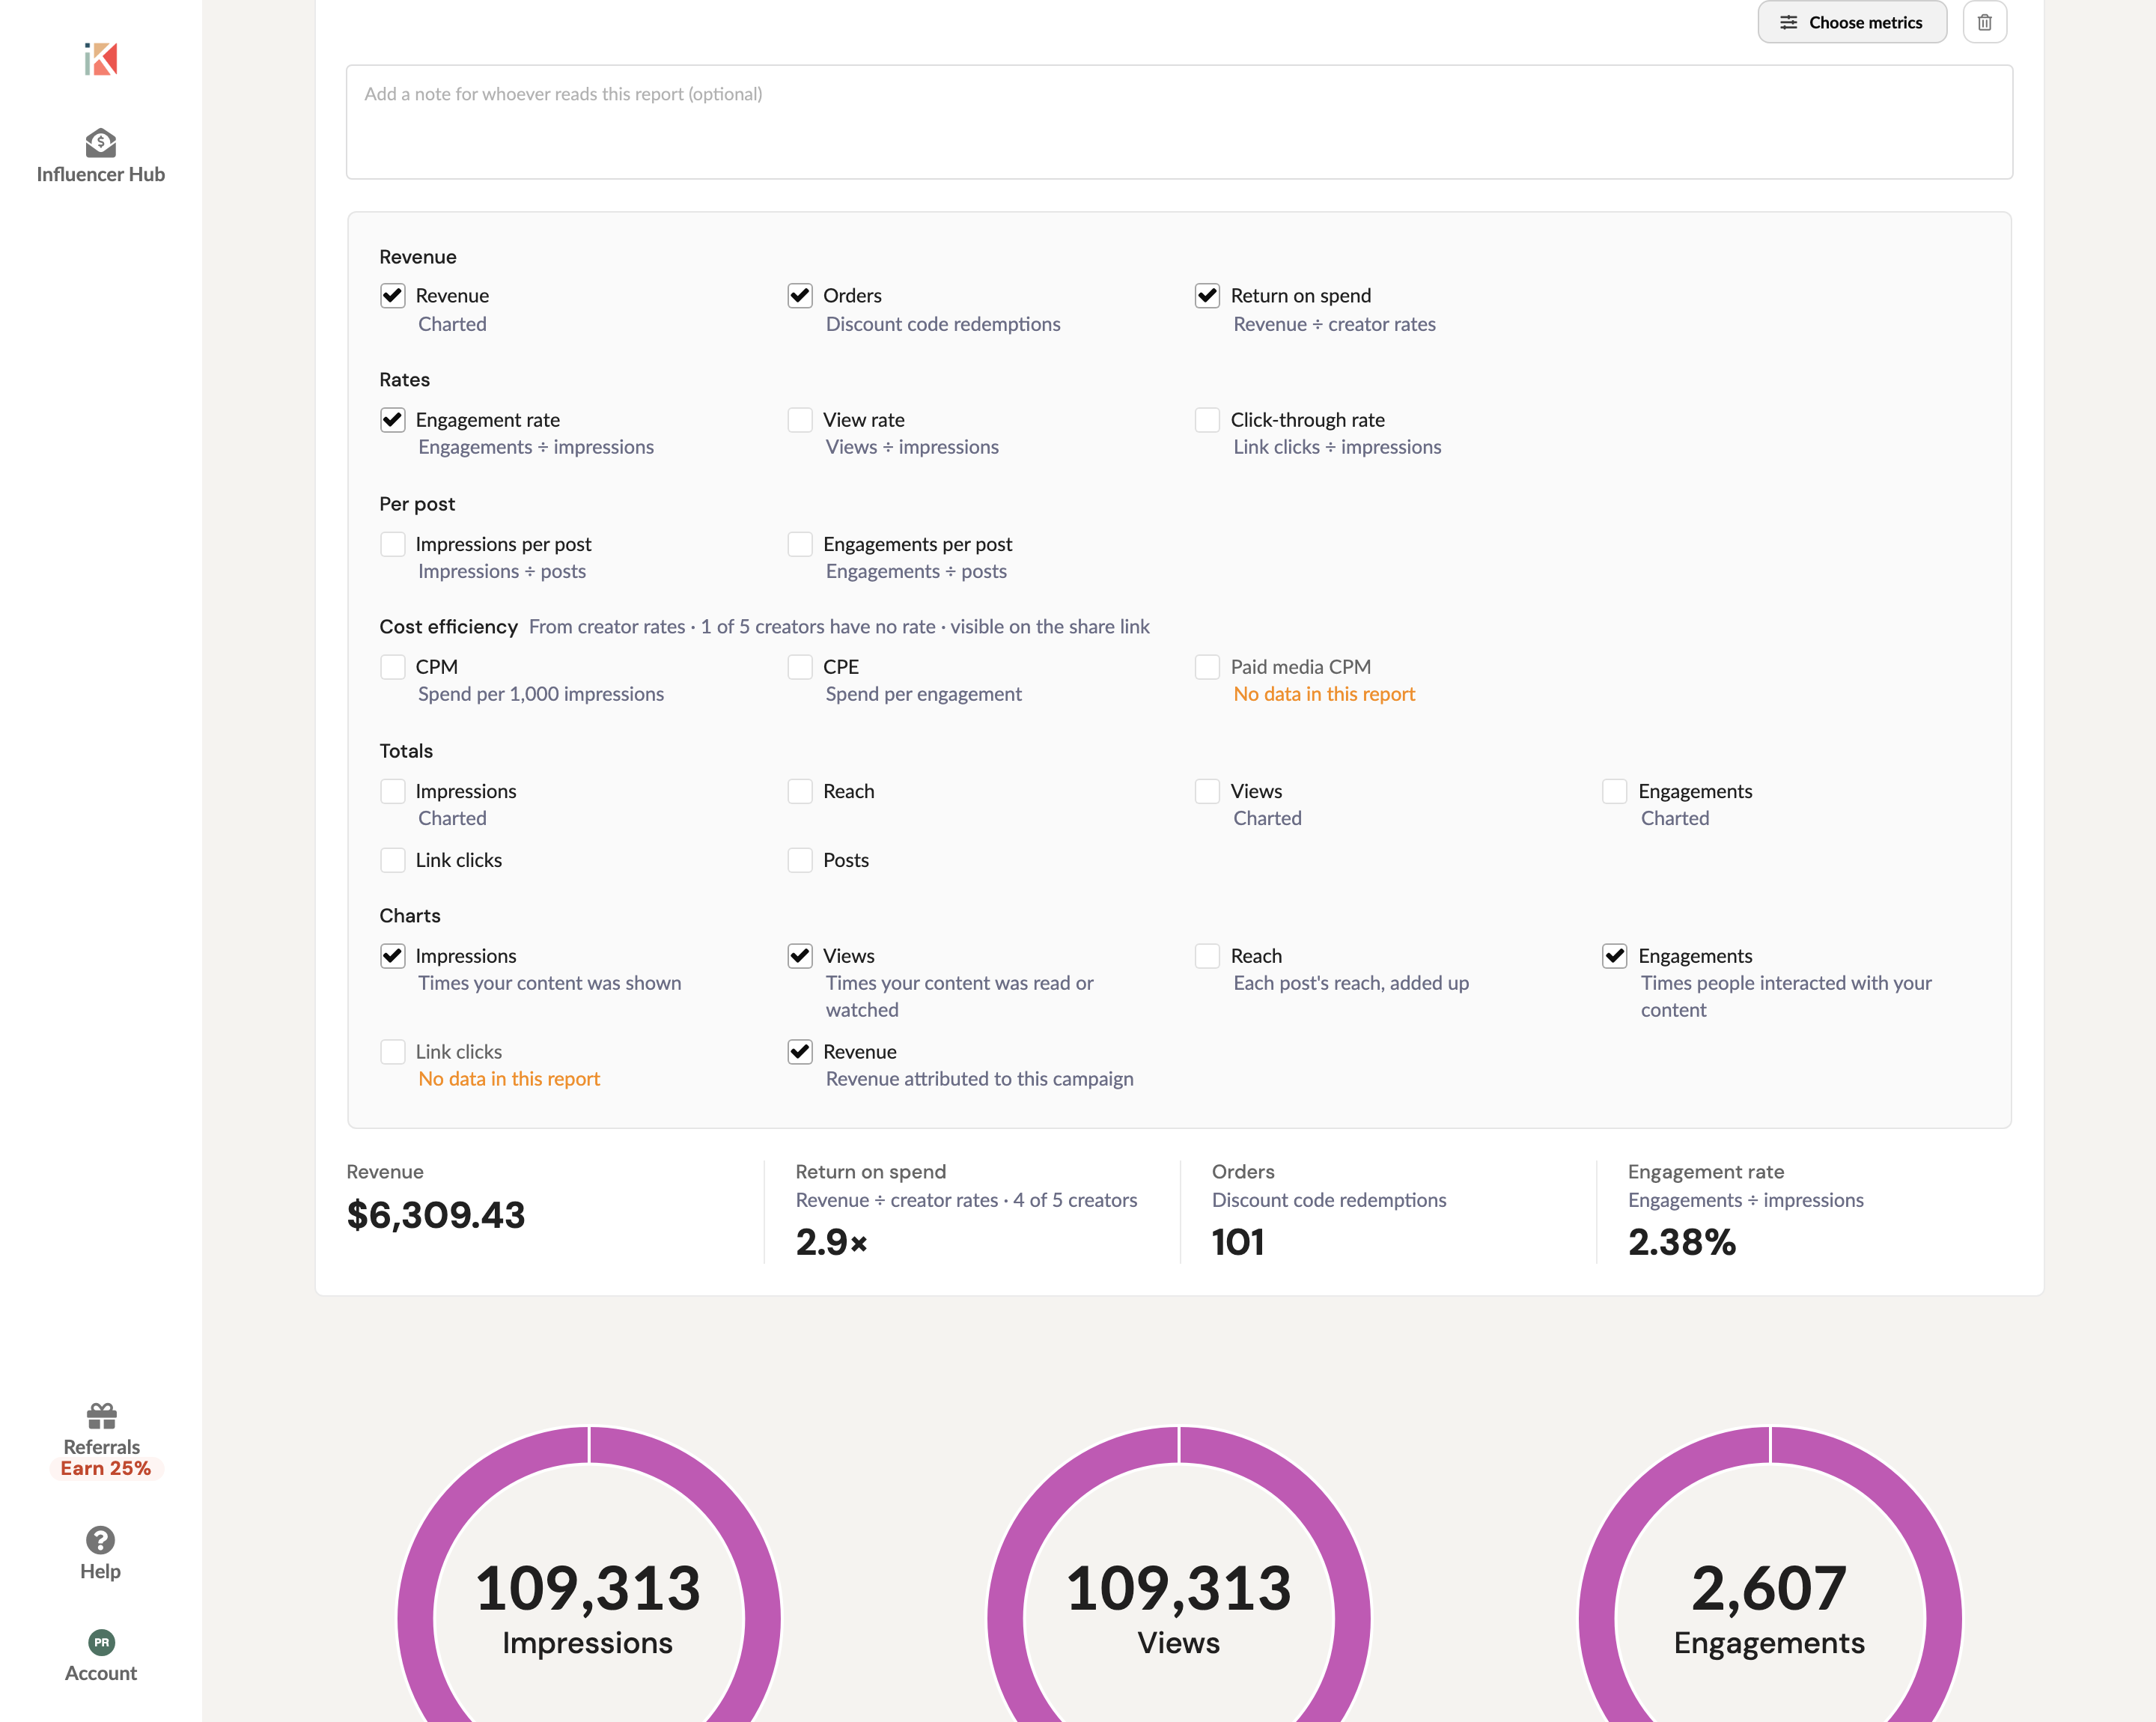
To add the numbers, open your report and click Add metrics, then use Choose metrics to pick which cards to show. They appear on your shared report link as well.
Rates
- Engagement rate — engagements ÷ impressions, across every post in the report
- View rate — views ÷ impressions
- Click-through rate — link clicks ÷ impressions
A note on Meta: Instagram and Facebook now report a single combined figure for impressions and views, so on reports made up of Meta content you’ll often see a view rate of 100%. That’s the platform, not an error — engagement rate per impression is the more useful number there.
Per post — impressions and engagements divided by the number of posts in the report. Handy when creators posted very different amounts.
Revenue — sales your report tracks, with the cards listed first in the picker:
- Revenue — sales from Shopify discount codes in the report, plus any revenue Google Analytics attributes to your links
- Orders — the number of times the report’s Shopify discount codes were used
- Return on spend — revenue ÷ the rates recorded for your campaign’s creators. A rate is what you entered on the campaign, so return on spend doesn’t tell you whether that amount was agreed or paid, and it doesn’t include product, shipping or ad costs.
If your report includes a Shopify discount code, the summary block shows revenue, return on spend, orders and engagement rate on its own, without you having to click Add metrics. You can change or remove those cards like any others, and once you do, your choice is kept.
Cost efficiency — CPM (spend per 1,000 impressions) and CPE (spend per engagement).
These, and return on spend, come from the rates on your campaign’s creators — there’s nothing to type in. They only appear on reports about a campaign: if you’re reporting on your own content there are no rates behind it, so the cost cards aren’t offered at all. Add or correct a creator’s rate and the report updates on the next load. If some creators don’t have a rate recorded, the picker tells you how many, so you know the figure is only counting the ones that do; if none of them do, the cost cards simply don’t appear. Return on spend also shows how many creators have a rate (“4 of 5 creators”). Revenue counts every creator’s code, so when some rates are missing, return on spend will read higher than it really is.
Paid media CPM is separate: it uses the ad spend and paid impressions we pull from Meta for boosted posts, not what you paid the creator.
Cost metrics are visible to anyone with your report’s share link. If you’d rather your client didn’t see what the campaign cost, leave those cards unselected.
Totals — impressions, reach, views, engagements, link clicks and post count are also available as cards. In the picker, the ones your report already shows as a donut chart are marked Charted.
Metrics that can’t be calculated from your report’s data don’t appear as cards at all, rather than showing an empty dash. Open Choose metrics and the picker explains what’s missing for each one.
Choosing the charts on a report
The donut charts under the summary show impressions, views, engagements and revenue by default. You can change them for each report: open the report, click Choose metrics (or Choose charts if you haven’t added summary metrics), and tick the charts you want under Charts. Each change saves as soon as you tick the box, and applies to the shared link and the PDF export too.
You can chart any of these:
- Impressions
- Views
- Reach — each post’s reach, added together. Someone who saw three of your posts counts three times, so treat it as total reach across posts, not the number of different people who saw the campaign.
- Engagements
- Link clicks
- Revenue
A chart only appears when the report has data for it; the picker says No data in this report next to any that don’t. Paid media charts (paid impressions, ad spend and paid reach) still appear on their own whenever a report includes boosted posts.
This is handy for Meta content. Instagram and Facebook now report one combined number for impressions and views, so on a report made up of Meta posts those two donuts often show the same total. Swap one of them for Reach.
Reports where you haven’t picked charts follow your workspace defaults. To change those, go to Settings → Organization Settings → Report Settings and tick the charts to hide by default.
Hiding individual stats
Hidden stats come off a post’s card, its reports and shared reports. They’re never deleted, and your report totals don’t change: un-hide a stat at any time to bring it back.
On one post: open the post and use Show or hide stats to uncheck the stats you don’t want shown.
For every post on a channel: go to Settings → Organization Settings → Show or Hide Stats. Each channel your account has posts on is listed with the stats its posts show. Click a stat to hide it on that channel’s posts (it gets a crossed-out eye), then click Update Stats. A post you’ve already set up under Show or hide stats keeps its own choice.
Showing a stat on one post that’s hidden by default: open the post and re-check the stat under Show or hide stats. That post now keeps its own choice. To put it back on your account default, click Use account default.
Where a post’s numbers came from
Each post card on a report has a small label saying where its stats came from. You’ll see the same label in the app, on a shared report and in the PDF.
- Pulled from Instagram (or TikTok, YouTube and so on): we fetched the numbers from the platform.
- From connected account: we fetched the numbers through the creator’s connected account.
- Entered by and a name: someone typed the numbers in or changed them by hand.
A post with no stats yet has no label.
Top comments
Instagram and Facebook post cards can also show up to three Top comments: positive comments we picked from the post’s comments. To hide them on a post, uncheck Top Comments under Show or hide stats.
Here’s what the different metrics are for each platform we support:
Instagram Reels
- Unique Impressions or Reach - the number of unique accounts that have seen the Reel at least once. (Note: Reach differs from impressions, which can include multiple views of a Reel by the same account. The metric is estimated and in development.)
- Views - the number of times the Reel starts to play after an impression is already counted. (This is defined as video sessions with 1 ms or more of playback and excludes replays.). Note: Meta now calls all impressions - plays + replays - views
Engagements:
- Saves
- Comments
- Likes
- Shares
- Avg. Watch Time - the average time spent playing the reel.
- Total Watch Time - the total time the Reel was played, including any time spent replaying the Reel.
Instagram Stories
- Views - the number of times this post was shown to any user (formerly called impressions)
- Impressions - the same figure as Views. Instagram no longer reports a separate impressions number for Stories, so the Views figure is used for both.
- Unique Impressions or Reach - the number of unique users who saw this post. Instagram calls this Reach, and Reach is the name you’ll see on the deliverable and in the custom stat editor.
You can correct any of these three yourself. Add a custom stat with the label Views, Impressions or Reach, and your number replaces the one we pulled from Instagram. The label is how we know which number you’re replacing, so it has to match exactly, capital letters included: a stat labelled reach or Unique Impressions is treated as a separate metric and gets added to the original instead of replacing it. The label box lists the stats already on that deliverable first, so picking the name from the list is safer than typing it. Full steps here.
Engagements:
- Replies - the number of replies the story received
- Shares - the number of times the story was shared.
NOTE: Instagram does not provide metrics for link clicks or stickers on stories. This is a limitation they have chosen to impose. If they change their policy and offer these metrics, we’ll add them. In the meantime, you can always add those metrics manually.
Story re-shares are not supported (you must be the story’s original creator in order for stats to work).
Instagram Posts, Videos, and IGTV (Instagram TV)
- Views - the number of times this post was shown to any user (impressions)
- Unique Impressions or Reach - the number of unique users who saw this post
- Video Views (IGTV and videos) - the number of times the video was viewed
Engagements:
- Likes
- Comments
- Saves
Note: Instagram stats do not include stats from boosted posts. Any views, engagements, or unique impressions that result from a boost will not be reflected in InfluenceKit. You can add those boosted stats manually without affecting the automatically updated stats.
Facebook Posts and Reels
- Views - the number of times this post was shown to any user (formerly known as Impressions)
- Impressions - shown alongside Views for posts where Facebook reports a single combined figure
- Avg. Video Time Spent - the average time viewers spent watching the video
Engagements:
- Post clicks - the number of times people clicked anywhere on this post without generating a story
- Comments - the number of comments on this post
- Shares - the number of times this post was shared
- Reactions - each reaction type (Like, Love, Wow, Haha, Sad, Angry) is listed as its own stat
Note: Facebook does not offer a post-saves metric through its Page Insights API, so saves can’t be pulled for Facebook posts or Reels. This is a Facebook limitation — Instagram, Pinterest, and TikTok saves are all supported. Facebook also no longer provides post-level unique reach for Pages, which is why you’ll see Views rather than Reach.
Facebook Stories are not yet supported. You can add these manually.
TikTok
What you get depends on how you connected TikTok. A TikTok Business connection returns TikTok’s full analytics set. A personal TikTok connection uses TikTok’s more limited Display API, which returns views and the basic engagement counts only. If a metric below is missing from your report, that’s usually why — you can reconnect TikTok as a Business account from your Connected Accounts page.
- Play Count - the number of times the video was played (views)
- Impressions - the number of times the video was shown
- Reach - the number of unique accounts that saw the video (Business connection only)
Engagements:
- Likes
- Comments
- Shares
- Favorites - the number of times viewers saved the video. TikTok calls saves “Favorites,” so that’s the label you’ll see on your report. (Business connection only)
Video performance (Business connection only)
- Total Watch Time - the total time viewers spent watching the video
- Avg. Watch Time - the average time spent per view
- Full Video Watched Rate - the share of views that watched the video all the way through
- Impressions by source - where the views came from, broken out by For You feed, Follow feed, Sound, Search, and Personal Profile
Google Analytics
- Pageviews - The number of times this page was loaded (impressions)
- Total time on page - the aggregate amount of time visitors spent on this page (time spent)
- Shares - the number of times this page was shared on social platforms (engagement)
- Average time on page - the average amount of time each visitor spent viewing this page (time spent)
- Outbound Clicks - the number of times visitors clicked a link on this page that took them to another site (for example, a click through to a brand’s product page). This comes from Google Analytics’ Enhanced Measurement outbound-click tracking.
Email and phone links are not counted
Google Analytics’ outbound-click tracking only fires for links that lead to a different website. Email links (mailto:) and phone-number links (tel:) don’t point at a website, so Google records no click for them and there is nothing for us to report. This is a limit of Google Analytics, not of InfluenceKit — and it applies no matter how many times someone taps the address or number on your page.
If those clicks matter to you, the site’s owner can add tracking for them in Google Analytics — most commonly a Google Tag Manager trigger that fires on mailto: and tel: links and sends a click event carrying the link’s URL. Once Google is recording them, they appear in the Outbound links to show picker like any other destination.
Choosing which outbound links to show
By default the report shows the total outbound clicks for the page. To count only specific destinations instead, open the deliverable and use the Outbound links to show picker to select one or more URLs. The report then counts just those, with a line for each one — “132 clicks to example.com/shop”. Leave the picker empty to go back to the page total. Outbound links only appear in the picker after the page’s stats have refreshed at least once.
Shopify discount codes
Add a creator’s discount link from your connected Shopify store (for example yourstore.com/discount/MAYA15) as a deliverable, and we’ll collect these metrics for the code:
- Revenue - total sales from orders that used the code
- Discount Redemptions - the number of times the code was used (shown as Orders in the summary block)
Note: we cannot pull stats for pins posted to group boards that are owned by someone else or stats from re-pins.
- Saves - the number of times this pin was saved (engagement)
- Pin Clicks (previously called “Closeups”)
- Outbound Clicks (previously called “Clickthroughs”)
- Comment count - the number of comments this pin received (engagement)
- Repin count
- Impressions - the number of times this pin was seen by users (impressions)
- Video views (video pins)
- Avg. View Time (video pins)
YouTube
- View count - the number of times this video was viewed (impressions)
- Likes - the number of users who ‘liked’ this video (engagement)
- Comments - the number of comments left on this video (engagement)
- Time watched - the amount of time users spent watching this video (time spent)
Why are YouTube stats not aggregated alongside other platforms?
YouTube’s API Terms of Service do not allow us to include YouTube data in aggregated stats and also prevent us from including any YouTube data on exported (PDF) reports. This means we have to break YouTube video stats out separately (more details here) and hide them when exporting PDFs.
LinkedIn stats are available only from posts published on LinkedIn pages. Stats for posts on personal profiles are not available.
- Impressions - the number of times this post was seen
- Shares - how many times the post was shared on LinkedIn
- Likes - how many times the post was liked
- Clicks - how many times a link within the post was clicked
- Comments - the number of comments that have been added to the post
Twitch
Twitch stats are available for videos. The only stat currently supported is:
- View count - the number of times this video was viewed
Mailchimp, Campaign Monitor, Kit.com (formerly ConvertKit) and other email platforms
- Unique opens - the number of times this email was opened (views)
- Clicks - the number of times any link within this email was clicked (engagements)
- Clicks to … - if you’ve used Track clicks for on the deliverable to pick particular links, you’ll see one of these per link instead of the single Clicks total. Use it when you’re one advertiser among several sponsors and only your own links should count toward the report.
Bitly Shortlinks
- Clicks - the number of times this shortlink was clicked (engagement)
Twitter/X
- Impressions - the number of times this tweet was seen
(NOTE: Twitter only provides impressions during the first 30 days after a tweet is posted) - Retweets - the number of times this tweet was retweeted (engagement)
- Favorites - the number of times this tweet was favorited (engagement)
Omny Studio
- Downloads - the total number of times the episode was viewed
- Reach - the number of impressions over the last 30 days
Transistor
- Total Downloads - (impressions) from last three years through now